Whether you’ve used them before or not, your statistics about your conference are an asset that can inform how you organize future events. With these tools, you will be able to closely and accurately gauge delegates’ interest from beginning to end, using the information at your fingertips to design future conferences that are increasingly successful.
But first… what are analytics?
Event analytics are detailed statistics about your event that provide a quantitative look at what parts of a conference were the most and least successful. We can think about analytics as all of the data that is compiled related to an event, such as information about attendees or visitor rates, that can be leveraged to make your meeting more successful.
On-site analytics can vary from simple attendance numbers to the amount of time spent at a venue, to level of satisfaction and engagement with the program. For conferences with virtual elements, the insights provided by online analytics can allow you to predict trends, target specific audiences, and ultimately increase interest and attendance at your event.
In the case of eposters, analytics are a particularly versatile tool. Regardless of the size of your conference, having posters means that many people will be sharing a lot of information within a relatively short timespan. Being able to track what people are looking at and listening to can provide crucial insights about popular topics and upcoming trends.

Analytics contain many forms of measurement such as clicks, views, and shares. Here are some examples of different types of analytics that are collected related to posters:
- Clicks: how many times a link was clicked
- Views: how many views a poster or video was viewed, either from start to finish or part way through–these are called “partial views”
- Impression: how many times a poster or video appeared in someone’s search results or was displayed
- Reach: the number of people who viewed a page, and where they reached a site from. This will typically either be direct traffic, search engine results, or a referral site.
- Shares: how many times a poster or video was shared, and in what ways (via a link, email, social media, etc.)
How do we use them?
Analytics are useful for all events, regardless of whether they are virtual, hybrid, or in-person. In fact, analytics can be used to determine the value of a platform and help you decide whether to keep using it in the future.
For instance, many conferences went fully virtual in 2020 while also seeing major drops in attendance. These drops in attendance were due to various reasons, including accessibility issues, other hardship, and the transition to work from home for many researchers and professionals.
When planning their 2021 events, some conference organizers opted for another year of virtual while others chose a hybrid model. Analytics allowed them to assess the success of each platform and inform their choices for 2022 and beyond. As a result, in 2022 we have seen more and more conferences return to in-person models, or expand their hybrid offerings, so as to boost engagement and attendance.
Here’s an example of how one conference used their data to inform changes that increased engagement after going virtual in 2021 to going hybrid in 2022 with just 30% of attendance being fully online (the remaining 70% were at least partially in-person).
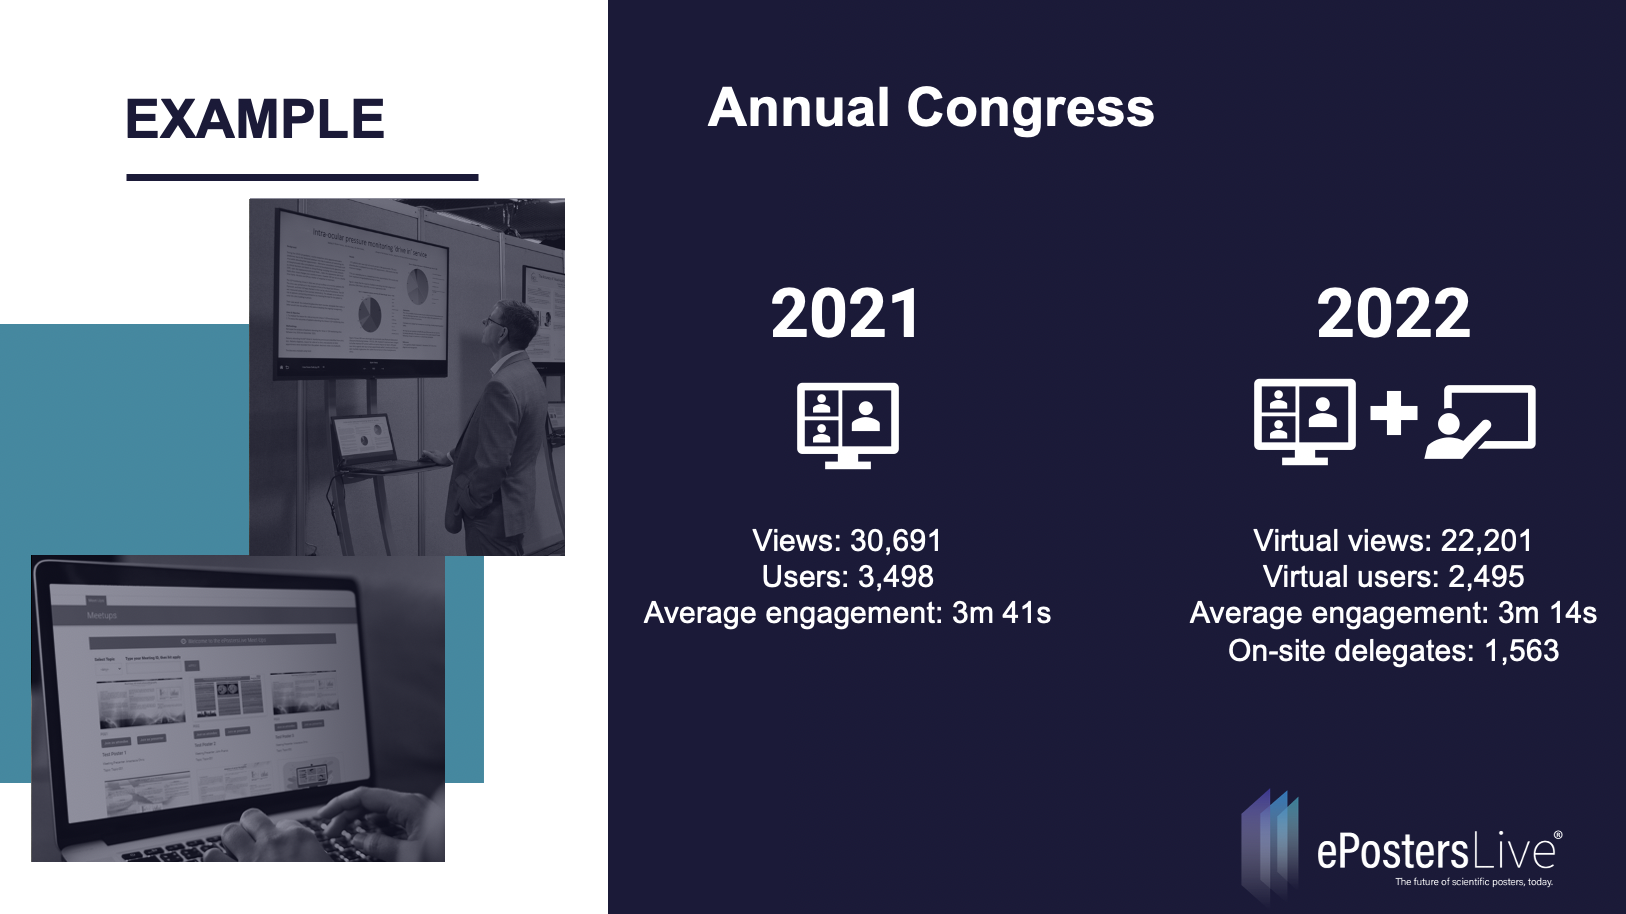
At first glance, there’s an obvious drop in online access from over 30,000 views from 3.5 thousand users to 22,000 views from 2.5 thousand users the following year. However, we can see that a large number of the on-site delegates and others still accessed the posters themselves and that the person-to-view ratio actually increased in 2022. Based on this, we can see a higher level of interest in the topics and content, likely among people who were on-site who found interesting posters making more of an effort to follow up and read them in more detail online.
So, what did the organizers do to see this increase in engagement? They used the data from 2021 to reassess their topics. Based on what was successful in 2021, in 2022 they introduced two new topics and removed two topics based on the levels of interaction and number of views. They also used the data regarding high interaction with specific posters to invite a small group of authors to present talks on their topics in 2022.
Benefits
The benefits of using analytics are threefold: informational, strategic, and competitive.
Informational: With analytics, you can access interesting information for you and your team to see what is popular and which topics people were interested in. This teaches you a lot about your audience, especially if you track which attendees have repeatedly attended your conference. Knowing what your return attendees care about will help you keep them coming back and attract new visitors as well.
Strategic: With this information, you can make tactical choices about specific sessions to host again, re-invite authors who had engaging posters, introduce and test new elements like oral presentations, video and audio elements, etc. Intentionally designing future programs will keep your engagement rates high and give attendees new elements to look forward to year after year.
Competitive: You can also offer rewards to the posters with the highest engagement, recognize top authors with a Keynote the following year, or even cash prizes. Adding these extra incentives to authors to make high-quality, shareable posters is a sure way to increase participation and talk about your conference.
ePL Analytics Dashboard Reveal
To make it easier for you to access and make the most of your event analytics, we designed our own Advanced Analytics Dashboard that became available this year. With this new tool, you can easily access the full picture of top authors, popular posters, and much more for your events, all in one place. The data collected is much more detailed than the simple stats automatically provided by Google Analytics. Users have access to the dashboard starting from the days before their conference, each day of the conference itself, and indefinitely afterward.
Have questions about analytics or using the Analytics Dashboard? Email us [email protected]