With ePosterCharts, you now know how engaging your poster program is—and much, much more.
Meet ePosterCharts™
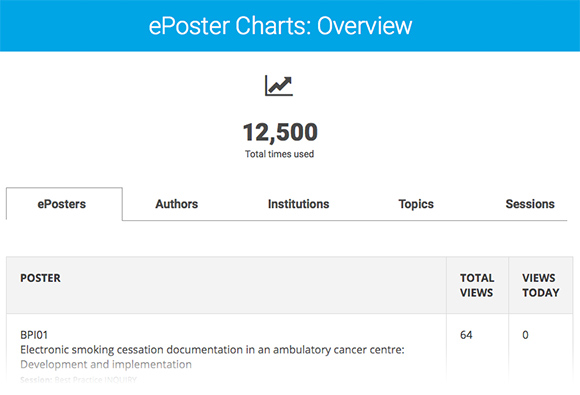
ePosterCharts™, the brand new feature of ePostersLive®, can now provide you with unprecedented insight into your ePoster program. ePosterCharts™ incorporates a sophisticated reporting mechanism, which enables you to track real-time detailed statistics of:
- the most popular ePosters,
- the most popular ePoster authors,
- the most popular institutions,
- and the most popular topics and sessions
of your poster program. And this is all thanks to the smart design of ePostersLive®, which differentiates the system pages for ePosters, authors, institutions, topics and sessions.
Covers both the on-site and the online portion of your program
Most conferences choose to have their ePosters published online – with the consent of their authors – during and after the event. The benefits of having those ePosters published online are multiple.
The insight offered by ePosterCharts™ is available for both your on-site program and afterwards, through the online ePoster archive dedicated to your conference.
Available on your laptop or your mobile device
Statistics collected and presented via ePosterCharts™ are compatible with any kind device. Therefore, the scientific committee and anyone else that needs to, can access those via laptop, smartphone or tablet, anytime during and after the conference.

Cost?
ePosterCharts™ comes bundled with ePostersLive® at no additional cost.
Find out more
To find out more about what ePostersLive® can do for your meeting, get in touch with us for a free 45-minute GoToMeeting demo or a quote tailored to the size of your poster program.
Includes revenue generating options
All we need is the number of posters